
India’s aviation sector continued to grow in FY 2025–26, with passenger traffic increasing across both domestic and international travel. Here’s how passenger traffic compared with the previous financial year.
India’s Aviation Passenger Traffic at a Glance
| Metric | 2024–25 | 2025–26 | Change |
| Domestic passengers | 165.5 million | 167.4 million | 1.1 % ↑ |
| International passengers | 74.1 million | 78.7 million | 6.1% ↑ |
| Total passengers | 239.7 million | 246.1 million | 2.7% ↑ |
Key Insight: Both domestic and international passenger traffic increased in FY 2025–26. Domestic departing passengers grew by 1.1%, while international passenger traffic, covering arriving and departing passengers, grew by 6.1%, according to DGCA.
India’s Aviation Passenger Traffic: Long-Term Growth
The following table and graph reveals three distinct phases in India’s aviation sector: pre-pandemic growth, the COVID-19 disruption, and a sustained recovery.
*Figures in millions
| Metric | 2015-16 | 2016-17 | 2017-18 | 2018-19 | 2019-20 | 2020-21 | 2021-22 | 2022-23 | 2023-24 | 2024–25 | 2025–26 |
| International passengers* | 50.2 | 54.9 | 60.8 | 64.1 | 60.8 | 8.8 | 21.2 | 54.6 | 66.8 | 74.1 | 78.7 |
| Domestic passengers* | 85.2 | 103.7 | 123.3 | 140.3 | 141.2 | 53.3 | 84.2 | 136 | 153.7 | 165.5 | 167.4 |
| Total passengers* | 135.4 | 158.6 | 184.2 | 204.4 | 202 | 62.1 | 105.4 | 190.7 | 220.5 | 239.7 | 246.1 |

Pre-pandemic growth: From 2015–16 to 2018–19, total passenger traffic increased from 135.4 million to 204.4 million. Domestic passenger traffic rose from 85.2 million to 140.3 million, while international traffic grew from 50.2 million to 64.1 million.
COVID-19 disruption: The decline accelerated in 2020–21, when domestic traffic fell to 53.3 million and international traffic plunged to 8.8 million amid widespread travel restrictions and lockdowns.
Recovery: By 2023–24, both markets had surpassed their respective pre-pandemic benchmarks. Growth continued through 2025–26, when domestic traffic reached 167.4 million and international traffic reached 78.7 million.
The trend indicates that COVID-19 interrupted, rather than permanently reversed, the long-term growth trajectory of Indian air travel.
Domestic vs International Passenger Traffic
Domestic and international passenger traffic have followed different growth patterns over the past decade. Comparing their year-on-year growth rates helps reveal how each market responded to the COVID-19 disruption and how growth has evolved during the recovery.
The following table compares annual passenger traffic growth in India from 2016–17 to 2025–26, based on DGCA statistics and AirportSaathi’s analysis.
| Metric | 2016-17 | 2017-18 | 2018-19 | 2019-20 | 2020-21 | 2021-22 | 2022-23 | 2023-24 | 2024–25 | 2025–26 |
| International % Growth | 9.4 | 10.7 | 5.4 | -5.1 | -85.5 | 140.9 | 157.5 | 22.3 | 10.9 | 6.1 |
| Domestic % Growth | 21.7 | 18.9 | 13.8 | 0.6 | -62.3 | 58.0 | 61.5 | 13.0 | 7.7 | 1.1 |

Key Insights:
1. International traffic experienced a sharper pandemic shock. In 2020–21, international passenger traffic declined by 85.5%, compared with a 62.3% decline in domestic traffic, highlighting the greater contraction in international air travel during the pandemic.
2. The recovery produced exceptionally high growth rates. International traffic grew by 140.9% in 2021–22 and 157.5% in 2022–23, while domestic traffic grew by 58.0% and 61.5%, respectively. These unusually high rates partly reflect the low passenger base during the pandemic.
3. Growth moderated by 2025–26. International passenger traffic grew by 6.1%, compared with 1.1% for domestic traffic. Both markets continued to expand, but at a slower pace than during the post-pandemic rebound.
Domestic vs International Share of Passenger Traffic
The share of domestic and international passenger traffic has changed over the past decade, with the COVID-19 pandemic causing a sharp shift in the reported traffic mix. The following table and chart show how these shares evolved from 2015–16 to 2025–26.
| Metric | 2015-16 | 2016-17 | 2017-18 | 2018-19 | 2019-20 | 2020-21 | 2021-22 | 2022-23 | 2023-24 | 2024–25 | 2025–26 |
| International Passenger Share % | 37.1 | 34.6 | 33.0 | 31.4 | 30.1 | 14.2 | 20.1 | 28.6 | 30.3 | 30.9 | 32.0 |
| Domestic Passenger Share % | 62.9 | 65.4 | 66.9 | 68.6 | 69.9 | 85.8 | 79.9 | 71.3 | 69.7 | 69.0 | 68.0 |
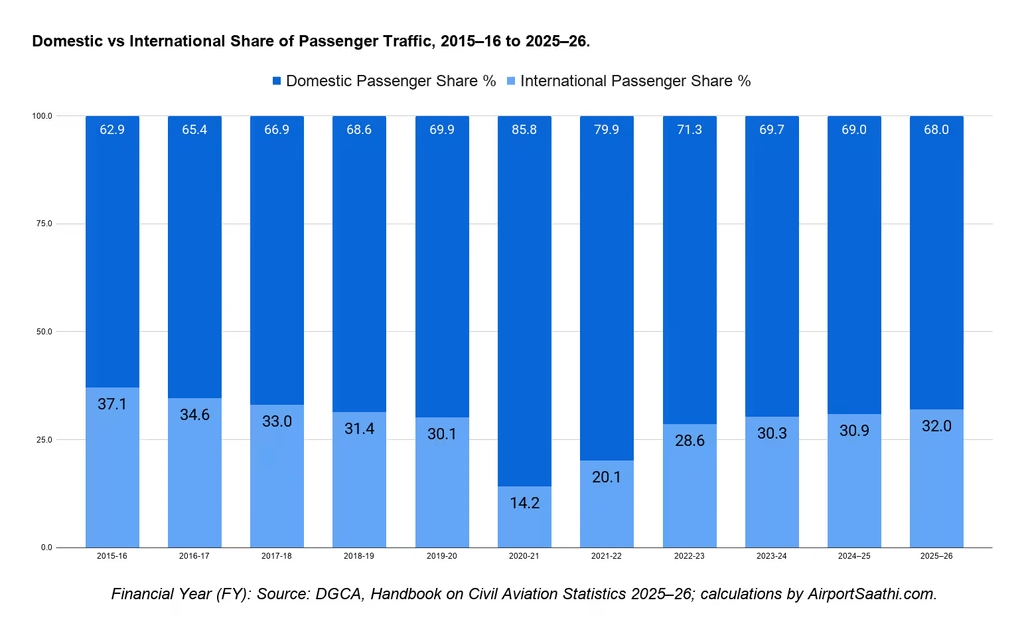
Key Insights: Domestic vs International Passenger Share
- Domestic traffic remains dominant: Domestic passengers accounted for 68.0% of the reported passenger total in 2025–26, compared with 32.0% for international passengers.
- COVID-19 sharply altered the traffic mix: The international share fell from 30.1% in 2019–20 to 14.2% in 2020–21, while the domestic share peaked at 85.8%.
- International share has recovered: By 2025–26, the international share had risen to 32.0%, exceeding its pre-pandemic share of 30.1% in 2019–20. The domestic share, at 68.0%, remained slightly below its 2019–20 level of 69.9%.
Key Findings
- Passenger traffic reached 246.1 million: The reported total increased by 2.7% over 2024–25, according to DGCA statistics.
- International traffic grew faster: DGCA reported 6.1% growth in international passenger traffic, compared with 1.1% for domestic departing passengers.
- COVID-19 disrupted consistent growth: Passenger traffic had grown consistently before the pandemic, but the sharp decline in 2020–21 interrupted this trend. Both domestic and international passenger traffic surpassed their respective 2018–19 levels by FY 2023–24.
- Domestic traffic remains the larger category: Domestic passengers represented 68.0% of the report’s stated passenger total in 2025–26, compared with 32.0% for international passengers. These shares should be interpreted in light of DGCA’s different counting bases for domestic and international traffic.
Related Topics
- Domestic Flight: A flight operating within the same country.
- International Flight: A flight connecting airports in different countries.
- Passenger Load Factor (PLF): A measure of how much of an airline’s available passenger capacity is occupied.
- Revenue Passenger Kilometres (RPK): A measure of passenger traffic based on the number of passengers carried and the distance travelled.
- Airport Terminal: The airport facility where passengers complete relevant travel formalities.
Data Source and Methodology:
Source: DGCA, Handbook on Civil Aviation Statistics 2025–26. Figures for 2025–26 are provisional. Domestic passenger figures cover departures, while international figures include arrivals and departures.
Calculations and analysis by AirportSaathi.com.